iOS Stats for Hanson Apps, Q3 2013
It’s time for another update of user insights from Hanson-developed iOS apps. If you’ve missed our previous reports, look up our first quarter stats and our second quarter stats. As you browse the latest numbers, keep in mind that this last quarter saw the launch of a new iPhone and iOS 7.
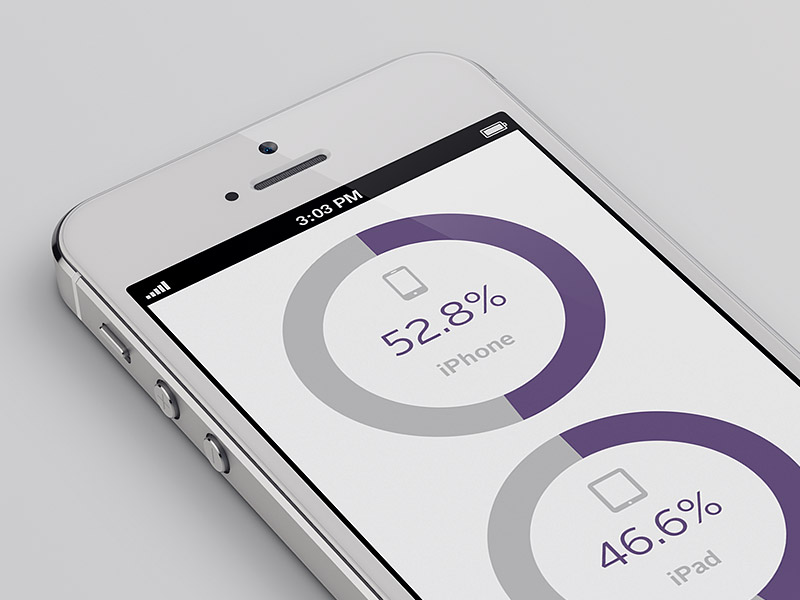
Here’s how the devices used this quarter compare to those from last quarter:

And here’s how the current versions of iOS compare to what we saw last time (note the incredibly fast adoption of iOS 7!):

We share these numbers every quarter to provide insights to anyone building a new app or updating an existing one. (Working on an Android app? We’ve got recent stats for that, too.) Let us know if you’ve found them helpful, or are interested in comparing your own stats.