Apple Statistics Q4 2013
Our latest round of Apple statistics brings us to more than a year of reporting on user demographics derived from iOS apps we’ve developed here at Hanson. We launched our reporting with data from September 2012 through April 2013 (think of it as Q1 2013 plus), followed by our Q2 report (May through July). The Q3 report (August through October) reflected the launch of iPhone 5 and iOS7.
Since mobile app development is a pretty big segment of what we do, and testing and research is a pretty big part of our process, we’ve been tracking our own data to complement the information Apple shares with developers. It’s a way to share with the development community what we’re seeing, and to help clients make informed decisions about the apps they’re planning or updating.
These numbers reflect only apps we’ve developed, so they don’t represent all users of all apps. But they do provide some insight into the evolving popularity of devices and versions.
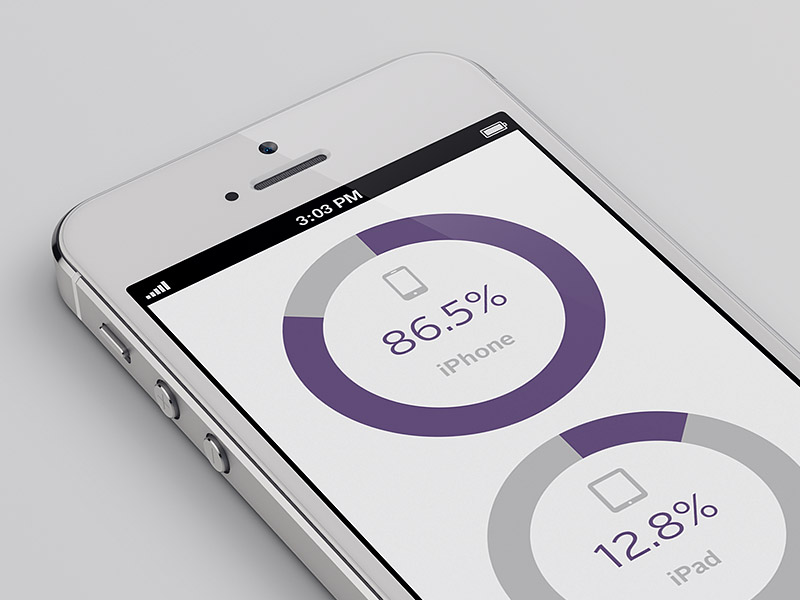
So on to our latest numbers. Here’s how Apple device usage compares to last quarter:

And here’s how the versions are stacking up since iOS7 released in September:

We’re tracking Android stats too; we released our Q4 2013 numbers last month.
Stay tuned for our next report!