iOS Stats: Insights from Hanson-Developed Apps
Apple is known for keeping mum about new products in development and user stats. That’s why there’s a whole industry on the web devoted to rumors about what Apple has in the pipeline. And it’s certainly their prerogative as a business strategy.
But the downside is that it offers developers little insight into app usage, operating system versions, or even the devices used. What can we see? The amount of weekly downloads segmented by country. That’s it.
Yes, statistics can be misleading. It’s hard to deduce cause and effect. But without the key insights stats can provide, it’s hard for you to make business decisions about your mobile apps. Like: should you invest 20% more to support iOS 4, an operating system that’s just over 2 years old (which is fairly new, considering we still use the 12-year-old Windows XP)?
If you could discover that the older device is only 2% of your market, it would make it a lot easier to choose between adding an important feature or spending the money on supporting the older device.
At Hanson, we’ve developed many mobile applications for many different markets, from games to creative endeavors to market research. We’ve gathered some statistics that go deeper than what Apple provides, and we think sharing them with you will assist in your digital strategy.
Here are some of the insights we’ve discovered. These are user demographics of apps we’ve developed, so keep in mind that they don’t represent all users of all apps. But they do provide a general sense of the devices and versions in use today.
Compare the versions used in April with those used last September, when version 6.0 released (on September 19):
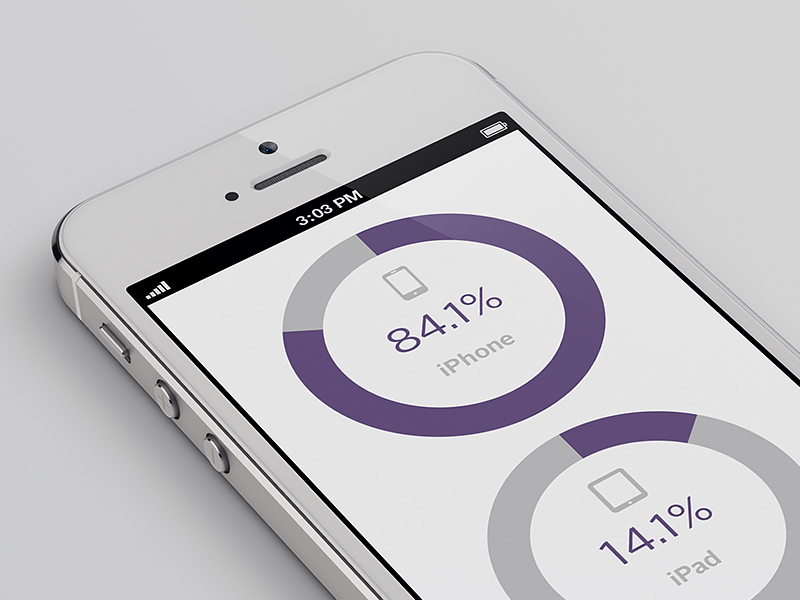
And here’s how the device usage stacks up, as of April 2013:
We’ll be sharing these statistics on a quarterly basis from now on, so be sure to stop back for an update in August.


