Android Stats for Hanson Apps, Q1 2014
Spring has finally arrived here in Northwest Ohio, and with it our latest report of Android stats based on Hanson-developed mobile apps.
Every quarter, we publish the devices and OS versions people are using to access apps we’ve built in house, as a way to share insights with the rest of the app development community. Our last Android report was Q4 2013; our last Apple report is here with another coming soon.
This graph reports on the versions used in January through March, compared to those used in October through December.

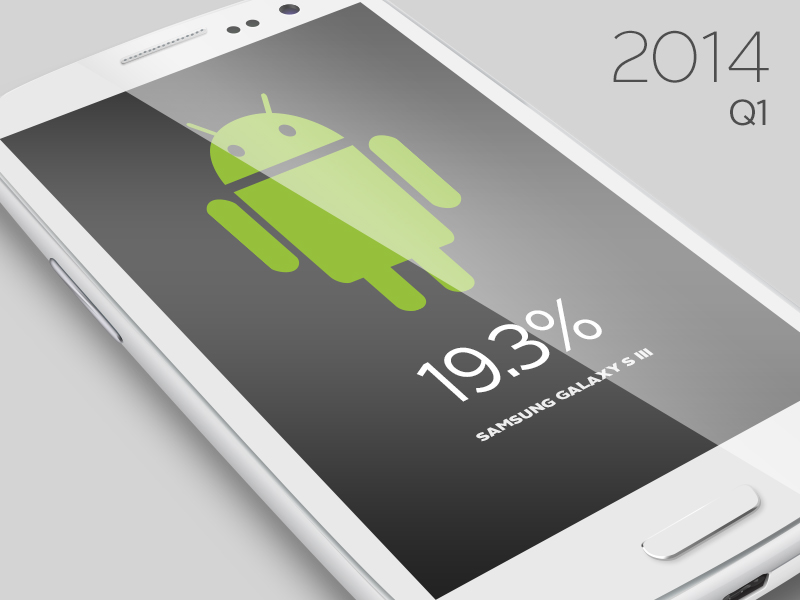
And this one shows how device popularity has shifted since last quarter, with the big change being the Google Nexus 7 breaking out of the “other” pack.

Stay tuned for the Apple report next month, and leave a comment if you’d like to share some insights of your own.