Android Stats for Hanson Apps, Q1 2015
With a new year comes another round of seeing how many Android devices are in use. We’re back for the first quarter of 2015 with our quarterly statistics as we continue to develop new apps and test the latest devices.
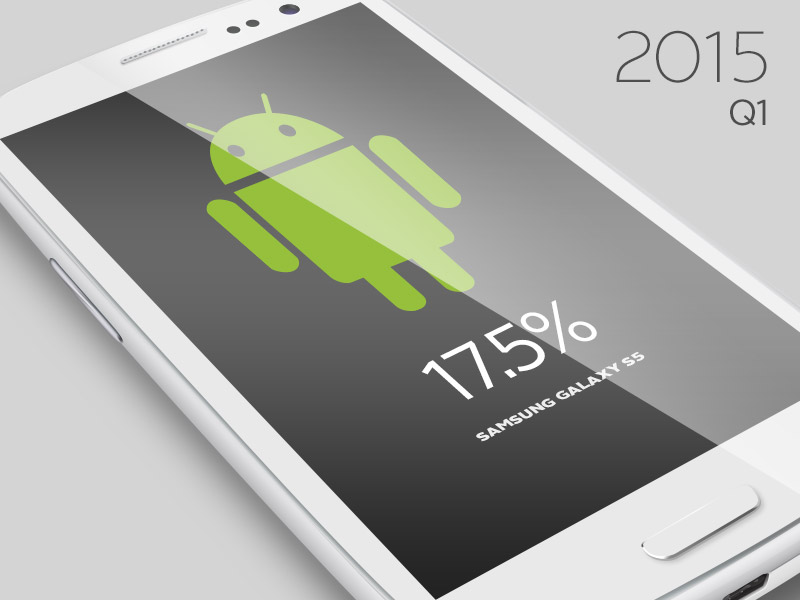
Here’s a comparison of Android devices used to access Hanson-developed apps during Q4 of 2014 and Q1 of 2015. Of the 119 devices we’ve logged (of thousands on the market), Samsung Galaxy devices are clearly in the lead. The Samsung Galaxy S5 continues to have the highest percentage of use at 17.5%.

And here is how the popularity of Android versions has shifted from the fourth quarter (October through December 2014) to the first (January through March 2015):

As you can see, version 4.4 remains the most popular version at 81.4%, with the release of version 5 in February making it the next most-used at 8.8%.
Check back next month for a new report on Apple statistics, or read our latest in the meantime.