Apple Stats for Hanson Apps, Q3 2014
As you may or may not know, we’ve been tracking the usage of all the iOS apps we develop in house to complement the information Apple shares with developers. We report these numbers every quarter to help clients make informed decisions about the apps they’re planning, and to contribute to the conversations happening in the development community. Our Q3 2014 stats are now in.
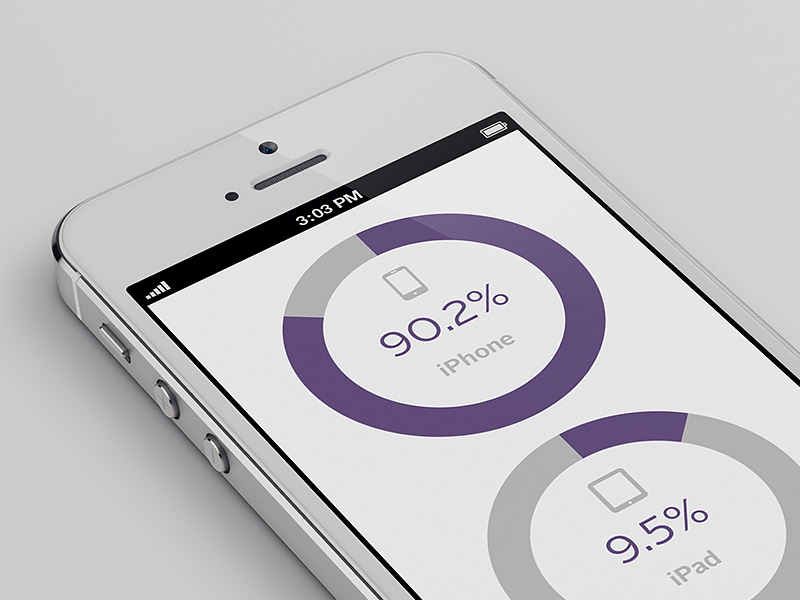
How does device usage compare to last quarter?

Here’s what we’re seeing with iOS versions:

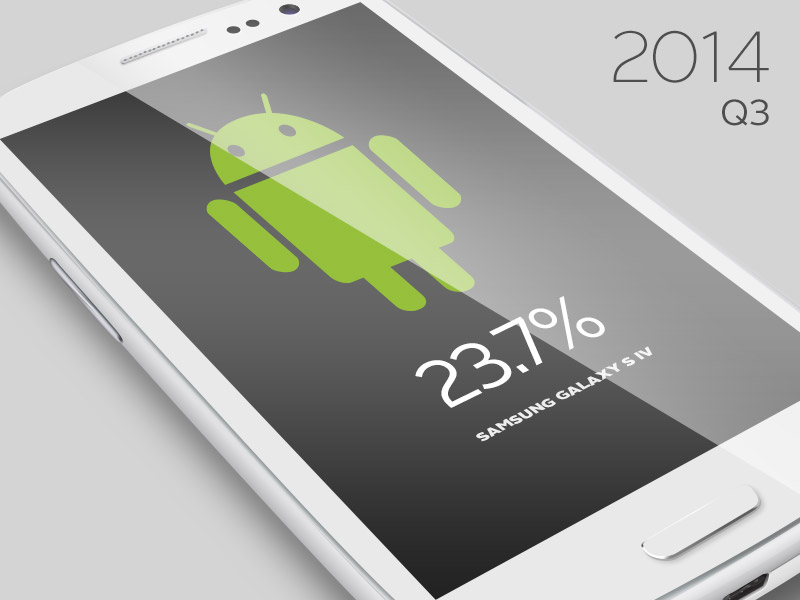
As predicted, there has been a change from last quarter with the release of iOS 8, which now takes over as the second most popular version. But it will be interesting to see what happens with these devices over the holidays as gift-giving season rolls around, so check back in February for our Q4 report. In the meantime, check out our latest Android stats report.