Apple Stats for Hanson Apps, Q1 2015
To complement the information Apple shares with developers, we track the usage of all of the iOS apps we develop in house. It’s been another three months of tracking as we’ve entered 2015, so it’s time to share our Q1 (February through April) stats for Hanson-developed iOS apps.
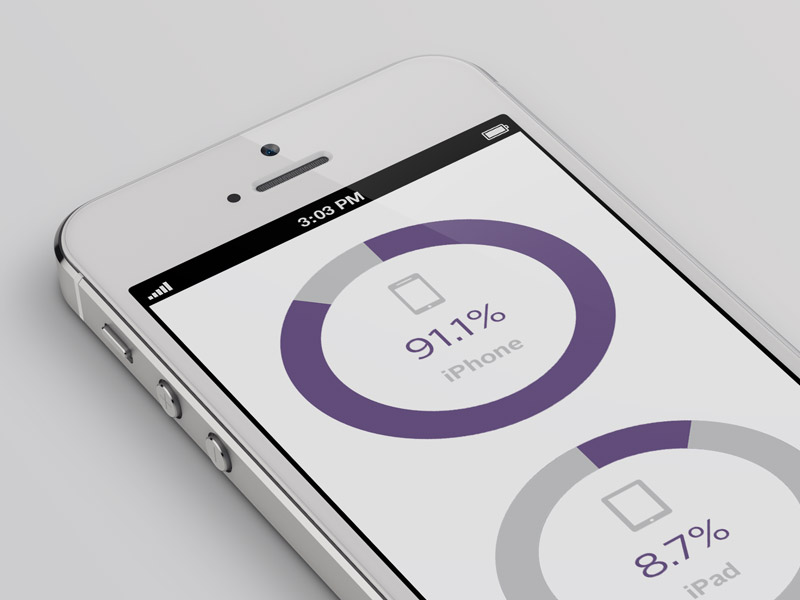
Let’s see how device usage compares to last quarter.

And here’s what we’re seeing with iOS versions:

As you can see, iOS 8 has continued to increase in popularity from last quarter and remains the most popular version. We’re looking forward to seeing what happens with these devices as the Apple Watch makes its way into the landscape and as we gather more insights about all things Apple at the WorldWide Developers Conference 2015 (3 Hansonites will be in attendance this year) so check back in August for our Q2 report. In the meantime, check out our Q1 Android stats report.